
Your gift is 100% tax deductible.
Mapping Mitochondria's “Dance” May Be a Path to Starving NSCLC
With multiple imaging techniques and AI, scientists create 3D stories about how mitochondria fuel tumors. The sequel? How to turn off the power source.
The Challenge
By the time most people are diagnosed with non-small cell lung cancer (NSCLC), it has spread outside the lung. How long people survive depends on how far the disease has spread from its starting point. If it is caught early, about 65% of people survive at least 5 years after diagnosis. If it has spread to distant parts of the body, only about 5% of people survive at least 5 years. To improve survival for people with this most common type of lung cancer in the United States, scientists want to learn more about how NSCLC tumors develop and grow.
One area they’re looking at is mitochondria. These are the tiny “powerhouses” in all the body’s cells, extracting energy from the nutrients in the food we eat and converting it into a form of energy that cells can use. Mitochondria move around rapidly, fuse together, and break apart. They change shape depending on the kind of nutrient they intend to “eat.”
Cells that need a lot of energy, like muscle cells—and cancer cells—can contain thousands of mitochondria.
Scientists have long known that mitochondria play a crucial role in how energy is processed and produced in cancer cells. They know that mitochondria form organized structural networks that affect how much energy cancer cells can make. But few studies have looked at exactly how these networks work to create energy.
Until recently, there has not been an easy way to get clear images of mitochondrial activity in living animals. Now scientists have developed a noninvasive way to capture images of mitochondria with the use of positron emission tomography, known as PET, combined with other imaging techniques and artificial intelligence (AI). The use of these technologies is the beginning of a new focus of NSCLC research.
The Research
American Cancer Society (ACS) research grantee, David Shackelford, PhD, works with the Jonsson Comprehensive Cancer Center at UCLA in Los Angeles. The Shackelford lab studies how cellular messages and metabolism interact, especially in terms of tumor development.
Shackelford and a team of researchers recently published a study in Nature describing how the activity of mitochondria in mice with NSCLC relates to the flow of energy (known as bioenergetic capacity) tumors need to keep growing.
Our study describes how creating highly detailed three-dimensional (3D) maps can help us understand the cellular, structural, and functional characteristics of mitochondrial networks in lung tumors using genetically engineered mouse models of NSCLC."

PET-guided multi-modality imaging of NSCLC. Shackelford's team generated 3-dimensional (3D), high-resolution maps of the mitochondrial networks in common subtypes of NSCLC tumors. To do that, they combined these 3 technologies.
- PET (positron emission tomography) imaging allowed the team to visualize mitochondrial activity noninvasively in living mice via PET by using a tracer that they developed for imaging lung tumors. The tracer literally accumulates in the mitochondria of tumor tissue enabling them to highlight cells and tissues that use lots of energy. With PET they saw that the two subtypes of NSCLCs they were studying, adenocarcinoma and squamous cell carcinoma, have distinct ways of producing and using energy.
- Micro CT scans, like medical CT scans, use X-rays to make images, but on a much smaller scale and with clearer resolution. Shackelford’s team scanned a small piece of an NSCLC tumor biopsied from a mouse.
- 3D electron microscopy provides highly detailed images of cross-sectional “slices” of mitochondria that allow for the construction of a 3D image. With an electronic microscope, Shackelford and his team could not only see how mitochondria moved around inside the cells but also how their inner membranes—the cristae—were organized. It’s well established that the structural organization of the cristae directly affects the capacity of the mitochondria to create energy that’s usable by the cell.
Using the 3D maps helped Shackelford's team begin to create a structural and functional atlas of lung tumors. "The atlas provides us with valuable insight into how tumor cells structurally organize their cellular architecture in response to the high metabolic demands of a growing tumor," Shackelford explains.
3D Topography of an NSCLC Tumor Landscape
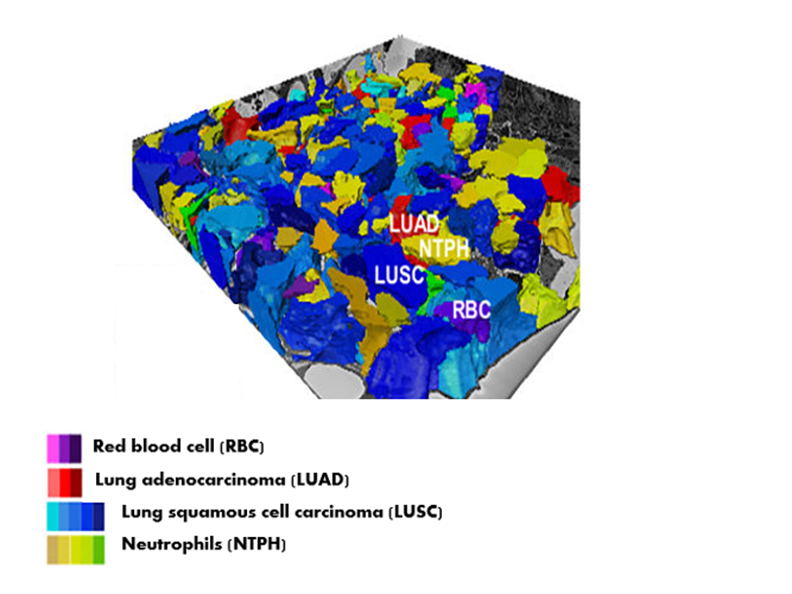
This 3D topography of an NSCLC tumor characterizes the spatial architecture of mitochondrial networks. David Shackelford’s research team created this “map” with the use of PET imaging, microCT, and electronic microscopy.
Spatial and structural mapping of mitochondria. To be able to see the organization of the mitochondrial networks within the adenocarcinoma and squamous cell carcinoma lung cancers, the researchers needed to have a way to comprehensively analyze the large amount of mitochondrial data captured on the two-dimensional (2D) images from the electron microscope. For that, they developed a deep-learning neural network.
Their deep-learning software uses an artificial intelligence technique that rapidly quantifies the mitochondrial architecture across hundreds of cells and thousands of mitochondria throughout the tumor. The resulting images show mitochondria in three dimensions, including the space around them and the cell's nucleus.
By partnering with Stefano Soatto, PhD, and his laboratory at the UCLA Vision Institute for deep learning technology, Shackelford's researchers built spatial maps of lung tumors that would have taken decades to accomplish with only the ability to label the images by hand.
The left image below shows manual labeling. Mingqi Han, PhD, a post-doctoral researcher in Shackelford's lab, traced each mitochondrion on a flat image from the electronic microscope. It took Han more than 2 weeks to mark up hundreds of images. In contrast, the deep-learning software analyzed 200 to 500 serial 2D images from the electron microscope, with 20,000 to 50,000 mitochondria within each tumor section in about 4 hours to create 3D images like the one shown on the right below.
3D Reconstruction of Mitochondrial Networks from
2D Electronic Microscope Images
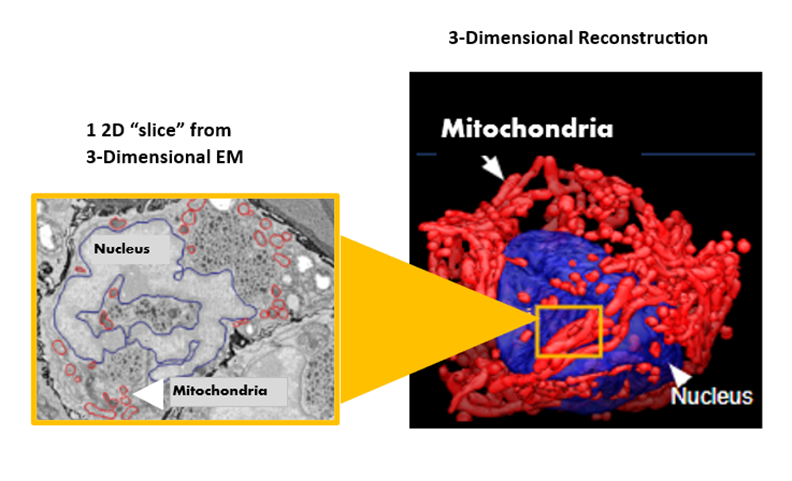
The image on the left is a flat, 2D image from the electronic microscope with mitochondria circled by hand. The software's analysis generated a 3D image of mitochondrial networks in NSCLCs (on the right). The nucleus of a lung cancer adenocarcinoma cell is blue, and the mitochondrial networks are red.
Our integration of multiple techniques to make images of NSCLC tumors showed us that the broad diversity of mitochondrial structures in tumor subtypes of NSCLC correlates with equally diverse bioenergetic profiles and metabolic dependencies, Shackelford says.
We learned that in different subtypes of NSCLC, mitochondria move in different patterns and that their internal cristae organize themselves to meet a tumor's high demand for energy so they can keep growing."
Organized Mitochondrial Networks in NSCLC Adenocarcinoma Tumors
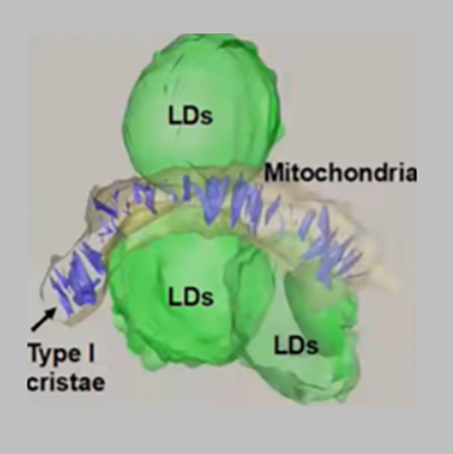
This 3D reconstruction shows how the highly organized and dense structure of a mitochondrion's cristae (purple) aligned themselves vertically in NSCLC adenocarcinoma tumors, which produce high amounts of energy. The green LDs are lipid droplets, which Shackelford's team noted in vast numbers in adenocarcinoma cells and nearly absent in squamous cell carcinoma cells.
Structural analysis offers more than just visually appealing 3D images, Shackelford says, it also paves the way for therapeutic interventions. "By examining the cellular organelles surrounding mitochondria in various NSCLC subtypes, we gain a clearer understanding of how tumors select their nutrient sources. Tumors can depend on sugars, proteins, and fats to meet their energy and growth requirements, he says.
Why Does It Matter?
Shackelford's study describes the first steps toward establishing high-resolution spatial maps of mitochondrial networks in lung cancer. The multimodality imaging approach he and his team used uncovered a previously unknown aspect of cancer metabolism. They revealed that a cancer's nutrient preference may be determined by the compartmentalization of its mitochondria.
Most notably, they discovered that mitochondria form discrete and highly organized subpopulations, called peri-droplet mitochondria, in lung tumors that help them grow and survive. These mitochondrial subpopulations could serve as new therapeutic targets and hold promise to inform and improve current treatment strategies while illuminating new directions to target lung cancer.
As researchers continue to understand the “dance” of mitochondria as they supply power to cancerous tumors, the closer they get to identifying places they may be able to change the steps, like removing or blocking the “food” source, to take away that power and kill cancer cells.
With time, researchers may be able to develop new metabolic-based therapeutic strategies for NSCLC as well as other types of cancer.